
Cash Flow Application Guide
Overview:
Using the annual corporate budget as a
baseline, the Cash Flow application develops a forecast of what the
resulting in-flow and out-flow of cash would be over the course of
the year.
The application is the For/act page of
the Financial Management Application and consists of five tables or areas of tabular data
and graphs as
shown in the following figure.
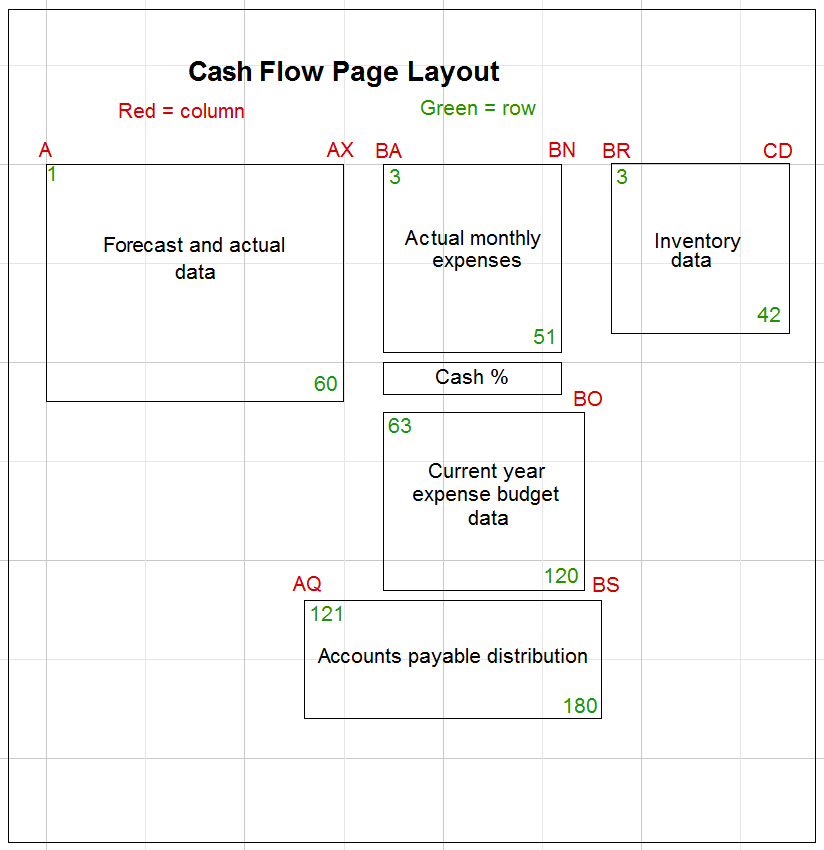
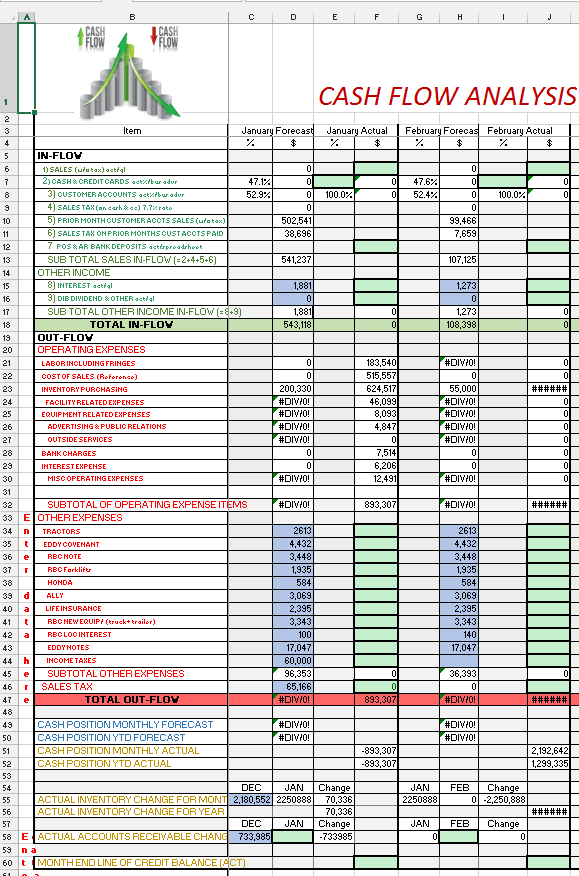
The primary area is a table with a
horizontal axis of monthly forecast and actual data and a vertical
axis of in-flow and out-flow data types. This information
covers the area of cells A1 to AX60. A portion of the table is
shown below.
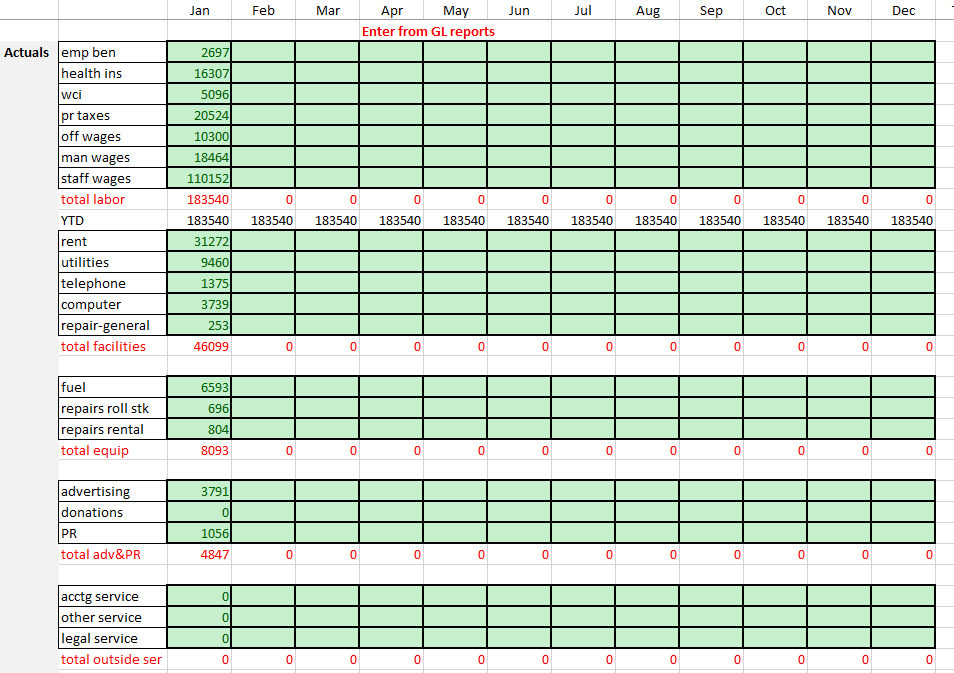
A table of monthly actual detail expense
data covers the area of cells BA3 to BN51. A portion of this
area is shown in the following figure.
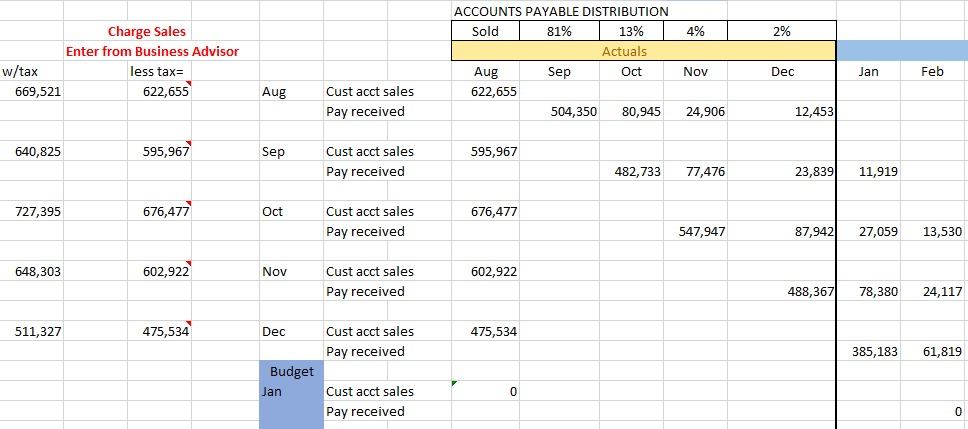
The third table contains the prior year's sales data and computation of the percent of sales that were cash transactions. The table is shown below. Data is entered in the yellow cells only.

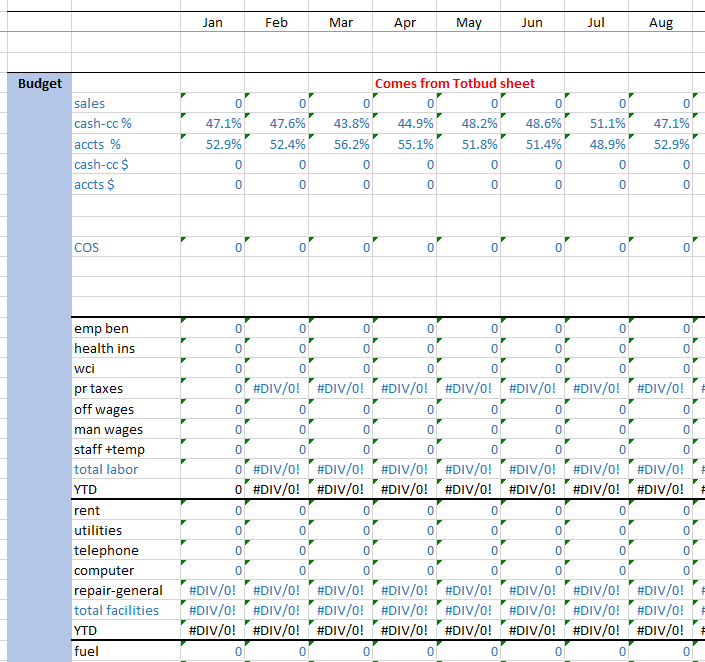
The fourth table is the monthly budget
detail expense data and covers the area of cells BA63 to BO120.
A portion of this table is shown below
The sixth table provides inventory actual and forecast data. A portion of the table is shown below.
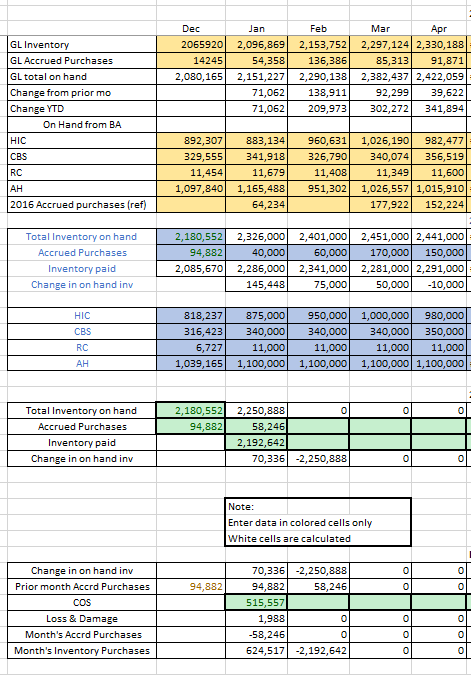
The top portion of the table records the prior year inventory performance. Data is to be entered in the yellow cells only. The next lower portion is used for entering the forecast inventory data for the current year. Data is to be entered in the blue cells only. The two lower portions of the table are to be used for recording current year inventory actual performance. Data is to be entered in the green cells only.
The following tabulation shows where monthly actual data is to be entered and where the data source is located. The month of January is used as an example.
Cash Flow Monthly Actuals Data Entry
January Example
Data Description
Cell Location
Data Source
Sales
F6
GL consolidated statement of income
Cash Sales %
E7
Business Advisor Cash sales/tot sales
Bank Deposits
F12
Bank deposit worksheet (Accounting)
Interest Income
F15
GL consolidated statement of income
DIB & other income
F16
GL consolidated statement of income
Other Expenses
F34 to F39
Notes payable work sheet (Accounting)
Life Ins
F40
Accounting memo
Other exp
F41 to F43
Notes payable work sheet (Accounting)
Income tax
F44
Accounting memo
Sales Tax
F46
Accounting memo
Accounts receivable
D58
GL consolidated balance sheet pg1
Line of credit balance
F60
GL consolidated balance sheet pg2
Inventory accrued
BS28
GL consolidated balance sheet pg1
Inventory paid
BS29
GL consolidated balance sheet pg1
Cost of Sales
BS39
GL consolidated statement of income
Expense accounts
BB5 to BB51
GL consolidated income, expense detail
Graphs Monthly Actuals Data Entry
January Example
Margin (gross profit)
AG19
GL consolidated statement of income